


UM Snow Day Calculator is an advanced predictive meteorological tool engineered to estimate the statistical probability of school cancellations, delayed openings, and district transit shutdowns caused by winter weather. By evaluating real-time atmospheric variables—including overnight snowfall accumulation depth, sub-freezing surface temperatures, freezing rain precipitation odds, sustained wind gusts, and road icing conditions—our calculator simulates the exact decision-making framework utilized by school superintendents, municipal public works departments, and student transportation fleets across the United States and Canada.
National Average Snowfall Threshold for District Closures
Wind Chill Index Triggering Hypothermia School Cancellations
Freezing Rain Glaze Causing Automatic 85%+ District Shutdowns
Critical Window When Superintendents Finalize Closure Calls
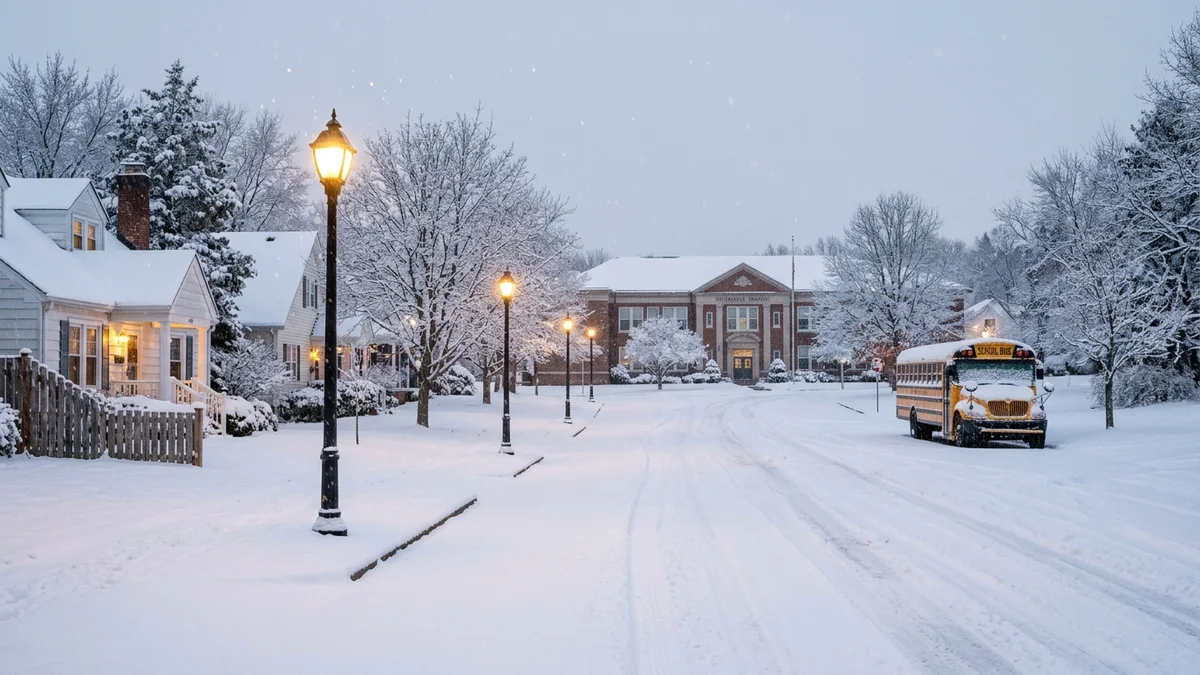
Yellow School Buses Navigating North American Winter Roads Daily
Standard Delayed Opening Window for Road Crews to Salt Arterials
Closures Caused by Secondary Street Icing Rather Than Main Highways
Baseline Snow-to-Liquid Ratio (SLR) for Atmospheric Calculations
How the Snow Day Calculator Predicts School Closures
Predicting whether a winter storm will trigger a school closure involves much more than simply glancing at an inch total on a commercial weather forecast. Superintendents and district transit coordinators operate under immense pressure: announce a closure too early on a forecasted storm that fizzles out, and parents scramble for emergency daycare while burning through banked instructional makeup days; wait too late or keep schools open during hazardous conditions, and thousands of 30,000-pound school buses transport vulnerable children across treacherous black ice.
Our Snow Day Calculator synthesizes multi-variable atmospheric data from high-resolution numerical weather prediction (NWP) models—including the High-Resolution Rapid Refresh (HRRR), North American Mesoscale (NAM), and Global Forecast System (GFS)—to deliver an actionable percentage score from 0% to 100%. The mathematical algorithm models four core environmental pillars:
1. Total Liquid-Equivalent Precipitation & Snow Accumulation Depth
Snowfall depth represents the baseline metric in any winter weather prediction. However, raw depth is dictated by the snow-to-liquid ratio (SLR). Light, powdery arctic snow at 20:1 SLR produces high visual depth with minimal water weight, allowing plows to clear roads rapidly. Conversely, heavy, maritime slush at 8:1 or 6:1 SLR coats road surfaces in dense slush that freezes solid, stalls municipal clearing equipment, and snaps tree limbs across power lines and bus routes.
2. Roadway Surface Temperatures & Thermodynamic Freezing Profiles
Ambient air temperature does not directly correlate with pavement temperature. If an early-season snowstorm drops 4 inches of snow while ground temperatures remain at 38°F (3°C) following a mild autumn week, pavement heat melts the initial accumulation, keeping road travel manageable. Conversely, when deep arctic air chills asphalt below 20°F (-7°C), standard chemical rock salt (sodium chloride) loses up to 80% of its melting efficacy, turning even light dusting into frictionless hard-packed sheets.
3. Precipitation Phase: Freezing Rain, Sleet, and Black Ice
Liquid water falling into a shallow sub-freezing surface layer creates freezing rain—the single most destructive winter weather hazard in North American school transportation. While a 4-inch snowfall might prompt a simple 2-hour delay in northern districts, a mere 0.10 inch (2.5 mm) glaze of freezing rain creates instantaneous black ice on elevated bridges, overpasses, and rural gravel roads. Our algorithm heavily weights ice precipitation codes, automatically elevating closure probability into severe tiers.
4. Sustained Wind Velocities, Gust Dynamics & Ground Drifting
Sustained winds exceeding 25 mph (40 km/h) paired with sub-freezing temperatures introduce severe logistical threats. In rural agricultural zones across the Midwest and Great Plains, crosswinds blow snow across cleared roadways, producing zero-visibility ground blizzards and multi-foot snowdrifts within minutes of a plow passing. Furthermore, intense winds drive wind chill values into dangerous hypothermia categories, making waiting at outdoor bus stops perilous for elementary schoolchildren.
The Atmospheric Physics of Winter Storms: Crystal Habit and the Dendritic Growth Zone
To appreciate why two snowstorms of identical moisture content produce radically different school closure outcomes, one must analyze the microphysics of cloud ice crystal nucleation. Snowflakes are not frozen raindrops; they are intricate crystalline structures that form via direct water vapor deposition onto microscopic ice-nucleating particles high in the troposphere.
The Dendritic Growth Zone (DGZ)
The atmospheric layer between -12°C and -18°C (10°F to 0°F) is known meteorologically as the Dendritic Growth Zone (DGZ). Within this precise thermal band, water vapor saturation with respect to ice reaches its global maximum. When upward vertical motion (omega) peaks inside the DGZ, ice crystals blossom into classic six-branched stellar dendrites. These dendritic structures possess interlocking arms that trap vast pockets of air, driving the snow-to-liquid ratio (SLR) upwards from standard 10:1 ratios to 18:1, 25:1, or even 30:1 in high-altitude intermountain regions.
Dendritic powder accumulates with astonishing speed—often at rates of 2.0 to 3.5 inches per hour during intense winter storm bands. While high-ratio snow looks imposing on lawns, municipal plows can displace it effortlessly. However, if strong winds accompany dendritic snowfall, the fragile arms fracture upon ground impact into microscopic shards, creating dense, cemented snowpacks that resist hand shovels and cause severe tire slippage.
Riming, Graupel, and Heavy Maritime Slush
When descending ice crystals collide with supercooled liquid water droplets (cloud droplets that remain unfrozen at sub-freezing temperatures), the liquid instantaneously freezes onto the crystal exterior. This process, known as riming, transforms delicate snowflakes into dense, pelletized graupel (soft hail) or heavily rimed flakes. Rimed maritime snow typically exhibits low SLRs of 6:1 to 8:1.
This “heart-attack snow” contains massive amounts of liquid water. A 6-inch accumulation of 7:1 snow exerts up to four times more mechanical stress on school building roofs, bus shelter awnings, and roadside utility trees than 6 inches of 20:1 champagne powder. When tree limbs bend and snap into high-voltage electrical lines, power outages darken schools and eliminate digital heating controls, forcing superintendents to declare multi-day closures regardless of road clearing speeds.
The Superintendent’s Decision-Making Framework: The 4:00 AM Protocol
To understand why the Snow Day Calculator generates specific odds, one must examine the rigorous, standardized protocol followed by school superintendents, directors of pupil transportation, and municipal public works managers during winter weather emergencies.
The Overnight Road Inspection Fleet
In most suburban and rural school districts, the closure decision begins between 3:30 AM and 4:30 AM. A designated “road scouting crew”—often comprised of the district transportation director, head mechanic, and senior municipal plow drivers—deploys in heavy-duty four-wheel-drive pickup trucks equipped with temperature sensors and friction gauges. These scouts travel three critical road categories:
- Primary State Corridors: Major multi-lane highways and state-maintained routes (e.g., turnpikes, expressways) that receive continuous salt application and priority plowing from state DOT fleets.
- Secondary Residential Subdivisions: Neighborhood feeder streets and cul-de-sacs with steep inclines, tight turning radii, and on-street parked cars that obstruct municipal plow blades.
- Rural Backroads and Bus Turnarounds: Unpaved gravel corridors, narrow bridges, and dead-end farm roads where school buses must execute multi-point K-turns without sliding into drainage ditches.
The 30,000-Pound School Bus Safety Equation
A standard Type C conventional school bus weighs between 25,000 and 32,000 pounds when loaded with 72 passengers. Due to high center of gravity, heavy rear axle bias, and long wheelbase, school buses cannot maneuver like passenger SUVs with all-wheel drive. On dry pavement, a school bus traveling at 35 mph requires approximately 115 feet to come to a complete emergency stop. On packed snow, that stopping distance extends to 280 feet; on glaze ice, stopping distance surpasses 500 feet—often exceeding the sightline of a driver rounding a residential corner.
If bus drivers cannot safely stop, turn around, or climb rural 8% inclines, superintendents have no legal or ethical choice but to cancel class. You can compute trip timings and employee shifts using our Calculadora de Horas Trabalhadas, or verify exact calendar date windows using our Calculadora do dia a dia.
School Bus Fleet Mechanics in Extreme Cold: Diesel Gelling & Pneumatics
Operating a fleet of 50 to 150 diesel-powered school buses in sub-zero weather introduces severe mechanical hurdles that directly force school cancellations, even when roadways have been plowed clear:
- Diesel Fuel Gelling: Standard Ultra-Low Sulfur Diesel #2 (ULSD) contains naturally occurring paraffin wax. At ambient temperatures below 15°F (-9°C), this wax begins crystallizing (known as the cloud point). If temperatures drop below 0°F (-18°C) without winterizing kerosene additives or cold-flow anti-gel chemical treatments, the fuel reaches its Pour Point and gels solid inside the fuel filters, starving bus engines of fuel and causing buses to stall midway through morning routes.
- Block Heater Infrastructure: In cold-weather districts, bus parking depots require hundreds of high-amperage outdoor electrical outlets to power engine block heaters overnight. A widespread power failure or blown transformer at a bus yard can leave an entire fleet cold-soaked and unable to crank over at 5:00 AM.
- Pneumatic Air Brake Freezing: Commercial school buses utilize heavy-duty air brake systems. Moisture condensed within pressurized air tanks can freeze inside delicate relay valves and brake chambers. If an air brake freezes open, the bus cannot release its spring-loaded parking brakes, immobilizing the vehicle completely.
Wind Chill Safety Guidelines & Frostbite Exposure Windows
Snow is not the only atmospheric condition that closes schools. In northern states like Minnesota, North Dakota, Wisconsin, and across Canada, “Cold Weather Days” occur under perfectly sunny skies. When the National Weather Service (NWS) issues a Wind Chill Warning with indices dropping to -25°F to -35°F (-32°C to -37°C), exposed skin develops frostbite in under 15 minutes. Because elementary school students frequently walk up to 0.75 miles to rural bus stops or wait outdoors for delayed buses, extreme wind chill triggers proactive district closures.
Regional Disruption Thresholds: Why 2 Inches Closes Atlanta but 8 Inches Spares Buffalo
A crucial factor in winter weather planning is geographic calibration. School districts in snow-belt regions maintain massive fleets of heavy rotary plows, heated salt barns, and snow-blower equipment. Conversely, southern districts that experience winter storms once every three to five years cannot economically justify multi-million-dollar municipal winter maintenance fleets. The table below illustrates the standard operational thresholds that dictate closures across different climate zones:
| Geographic Region | Representative Metro Areas | 2-Hour Delay Threshold | Full Snow Day Threshold | Ice / Glaze Sensitivity | Municipal Winter Readiness |
|---|---|---|---|---|---|
| Deep South & Gulf Coast | Atlanta, GA; Dallas, TX; Charlotte, NC | 0.25 – 0.5 inches | 1.0 – 2.0 inches | Extreme (>0.05" cancels) | Minimal plows, sand spreaders only |
| Mid-Atlantic Corridor | Washington, DC; Philadelphia, PA; Richmond, VA | 1.5 – 3.0 inches | 4.0 – 6.0 inches | High (>0.10" cancels) | Moderate plow fleets, extensive rock salt |
| New England & Tri-State | Boston, MA; Hartford, CT; New York, NY | 3.0 – 5.0 inches | 6.0 – 9.0 inches | Moderate (Treated with brine/MgCl2) | Heavy state/town DPW infrastructure |
| Great Lakes & Lake Effect | Buffalo, NY; Cleveland, OH; Syracuse, NY | 5.0 – 8.0 inches | 10.0 – 14.0 inches | Routine (Continuous snow blowers) | Exceptional heavy equipment & rotary blowers |
| Upper Midwest & Northern Plains | Minneapolis, MN; Fargo, ND; Milwaukee, WI | 4.0 – 6.0 inches | 8.0 – 12.0 inches | Severe cold priority (Wind chill <-25°F) | Vast continuous plowing fleets, pre-treated roads |
| Rocky Mountains & High Plains | Denver, CO; Salt Lake City, UT; Cheyenne, WY | 4.0 – 6.0 inches | 8.0 – 12.0 inches | Low (Dry powder melts rapidly under sunshine) | Chained bus tires, mountain plow graders |
| Pacific Northwest Metro | Seattle, WA; Portland, OR | 0.5 – 1.5 inches | 2.0 – 4.0 inches | Extreme (Steep hills, maritime wet slush) | Limited plow fleets, steep topography hazards |
| Canadian Prairies & Ontario | Toronto, ON; Calgary, AB; Winnipeg, MB | 10 – 15 cm | 20 – 30 cm | Standard winterized fleet (Treated with brine) | Mandatory winter tires, 24/7 municipal plows |
Road De-Icing Thermodynamics: Chemicals, Brines & Pavement Physics
Municipal road clearing is an exact science governed by colligative properties and freezing point depression. When winter storms approach, transportation departments do not merely push snow with steel blades; they chemically alter the molecular freezing point of moisture on the pavement.
| De-Icing Chemical | Chemical Formula | Effective Working Temp | Eutectic Point | Environmental & Infrastructure Impact |
|---|---|---|---|---|
| Sodium Chloride (Rock Salt) | NaCl | 15°F to 20°F (-7°C to -9°C) | -6°F (-21°C) | Most common, low cost; corrosive to concrete and vehicles |
| Calcium Chloride | CaCl2 | -20°F to -25°F (-29°C to -32°C) | -60°F (-51°C) | Exothermic reaction generates heat; fast-acting; higher cost |
| Magnesium Chloride | MgCl2 | 0°F to 5°F (-15°C to -18°C) | -28°F (-33°C) | Less corrosive than rock salt, safer for roadside vegetation |
| Liquid Salt Brine (23.3%) | H2O + NaCl | 15°F (-9°C) pre-treatment | -6°F (-21°C) | Prevents snow-to-pavement bonding; applied 24h prior to storms |
| Abrasive Sand & Grit | Inert silica / stone | Any temperature (No chemical melt) | N/A | Provides physical tire traction on ice; clogs storm drainage |
When pavement temperatures dip below 15°F (-9°C), standard rock salt becomes inert. Districts that experience rapid temperature plunges following wet precipitation face frozen slush that cannot be melted chemically, making snow day closures practically guaranteed. If you are planning home driveway repairs or heated snowmelt slabs, review our Calculadora de custos de lajes de betão.
State Educational Mandates & Calamity Day Banking Policies
A major hidden factor in a superintendent’s calculus is the statutory requirement governing public school instructional calendars. School districts do not enjoy an infinite reserve of snow days; every canceled day carries administrative and financial consequences under state law.
The 180-Day Instructional Standard
Most states—including Pennsylvania, New York, New Jersey, Illinois, and California—statutorily mandate that public schools provide a minimum of 180 days of pupil instruction per academic year. Several other states, such as Ohio and Texas, define attendance requirements in instructional hours (typically 910 hours for elementary schools and 1,001 hours for secondary schools). To accommodate inevitable winter weather interruptions, school boards standardly build 3 to 5 “banked calamity days” into their published autumn calendars.
What Happens When Calamity Days Are Exhausted?
When severe winters bring historic snow accumulations—such as the polar vortex winters of 2014 and 2019—districts frequently exhaust their built-in snow day reserves by early February. Once calamity days are exhausted, superintendents face difficult trade-offs:
- Canceling Scheduled Spring Breaks: Districts can claw back instructional days by shortening or eliminating March and April spring recess breaks.
- Extending the Academic Year Into Late June: Adding days to the end of the school year pushes high school graduation ceremonies back and clashes with scheduled summer building renovations.
- Converting In-Service Days: Teacher professional development days scheduled on Mondays or Fridays are converted to active student attendance days.
- Deploying Digital Flexible Instruction Days (FIDs): Approved districts can substitute physical closures with asynchronous or synchronous remote learning modules, counting the day as full instructional credit.
School District Options: Snow Day vs. 2-Hour Delay vs. Remote Learning
Modern superintendents have a multi-tier toolkit to handle adverse winter conditions without immediately sacrificing an entire instructional day. The decision tree standardly balances student safety against state educational attendance mandates:
| District Decision | Operational Trigger | Primary Advantage | Key Limitations & Challenges |
|---|---|---|---|
| Full Snow Day (Cancellation) | Heavy accumulation (>6-10"), active morning ice, severe wind chill (<-20°F) | Zero transit risk for buses, students, and instructional staff | Must be made up at end of school year; disrupts working parents |
| 2-Hour Delayed Opening | Storm ending by 5:00 AM, light snow (2-4"), early ice melting with sunrise | Gives municipal plows daylight and time to salt neighborhood roads | Condensed class periods; challenging for parents with fixed shifts |
| Early Dismissal | Storm starting earlier or intensifying faster than forecasted between 11 AM – 1 PM | Gets students home before peak evening accumulation and freezing | Extremely hazardous; leaves young children home alone if parents work |
| Flexible Instruction Day (FID / Remote) | Moderate snow where digital learning infrastructure is fully established | Counts toward state 180-day mandate without extending school year into June | Screen fatigue, lack of childcare supervision, internet outages from snow |
Real-World Meteorological Case Studies
To examine how real-time meteorological variables combine to influence school operational outcomes, consider these three documented case studies across contrasting North American climate regions:
Case Study 1: The New England Nor’easter (Boston Metro Suburbs)
Meteorological Conditions: An intensifying coastal bomb cyclone tracked 70 miles offshore of Nantucket, spreading heavy banding snow across eastern Massachusetts between 1:00 AM and 11:00 AM. Total snowfall accumulation reached 9.5 inches with sustained winds of 32 mph and peak gusts of 48 mph. Air temperature remained steady at 28°F (-2°C) with an 11:1 snow-to-liquid ratio.
Calculator Prediction: 94% Probability (Extreme / High Closure Tier).
Outcome & District Action: At 4:45 AM, the regional superintendent council issued a unified district-wide cancellation. Plowing fleets were overwhelmed by snowfall rates exceeding 1.5 inches per hour, creating near-whiteout conditions along secondary bus corridors. A delayed opening was impossible due to peak snowfall timing coinciding directly with the 7:00 AM to 8:30 AM student commute window.
Case Study 2: The Midwest Polar Vortex Event (Minneapolis Suburban District)
Meteorological Conditions: Clear, cloudless skies with zero fresh snowfall accumulation. However, an arctic air mass established ambient air temperatures of -14°F (-26°C) with sustained northwest winds of 18 mph, producing a National Weather Service Wind Chill Index of -34°F (-37°C) between 5:00 AM and 9:00 AM.
Calculator Prediction: 88% Probability (High Closure Tier based on extreme cold weather thresholds).
Outcome & District Action: Despite clear, dry road conditions and zero snow on the pavement, the superintendent declared a full cold-weather cancellation at 5:15 AM. School district safety policy mandated that wind chill values colder than -25°F present an unacceptable danger of hypothermia and frostbite for over 4,200 elementary students walking to bus stops or waiting outdoors for delayed transit.
Case Study 3: The Mid-Atlantic Sleet & Freezing Rain Glaze (Greater Philadelphia)
Meteorological Conditions: A warm front overrunning cold low-level surface air deposited 1.0 inch of snow followed by 0.20 inches (5 mm) of sleet and freezing rain between 3:00 AM and 6:30 AM. Ambient temperature was 31°F (-0.5°C) with pavement temperatures hovering at 29°F (-1.7°C).
Calculator Prediction: 91% Probability (High Closure Tier driven by ice precipitation codes).
Outcome & District Action: The district initially considered a 2-hour delay. However, road scouting at 4:45 AM revealed that falling freezing rain was creating a glaze of black ice across unheated bridges and neighborhood hills faster than salt trucks could treat them. Several municipal salt spreaders skidded on secondary grades. The superintendent upgraded the delay to a full cancellation at 5:30 AM, preventing severe multi-vehicle accidents during morning bus runs.
Economic & Societal Impacts of Snow Days
While children eagerly anticipate building snowmen and sledding down neighborhood hills, a widespread snow day carries staggering macroeconomic consequences. Understanding the broader financial ripples of winter shutdowns highlights why administrators work tirelessly to keep schools open whenever safely possible.
Lost Labor Productivity and Childcare Costs
According to economic studies published by the Federal Reserve Bank and IHS Markit, a single day of severe winter storm shutdown across a major metropolitan corridor results in between $500 million and $1.4 billion in lost economic productivity. When elementary and middle schools close with just 90 minutes of advance notice, hundreds of thousands of working parents must either call out of work, burn paid time off (PTO), or scramble for emergency childcare services that cost between $75 and $150 per day.
For hourly wage workers without paid sick leave or remote work flexibility, a snow day directly reduces gross monthly earnings. Employees tracking irregular schedules or overtime during winter emergency shifts can project their net earnings using our Calculadora de Salários do Texas or audit cumulative weekly work times via our Calculadora de Horas Trabalhadas.
Municipal Snow Removal Budgets
Clearing public roadways after a single major winter storm costs large municipalities enormous sums. Cities like Boston, New York, Chicago, and Minneapolis budget between $40 million and $130 million annually for winter highway maintenance. A single 10-inch blizzard consumes:
- Rock Salt Consumption: Upwards of 40,000 to 75,000 tons of chemical sodium chloride spread across city streets in 24 hours. Hardware retailers and building suppliers pricing bulk salt inventory can calculate gross retail margins using our Calculadora de margem de lucro.
- Heavy Equipment Overtime: Hundreds of contract plow drivers, front-end loader operators, and mechanic crews earning time-and-a-half or double-time municipal overtime over 36-hour continuous shifts.
- Infrastructure Repair: Frost heaves, pavement potholes, and sheared curb granite caused by steel plow blades colliding with street edges at 25 mph.
Step-by-Step Guide: How to Use the Snow Day Calculator
Our Snow Day Calculator is designed for speed, scientific precision, and ease of use across both mobile smartphones and desktop computers. Follow this simple walkthrough to evaluate school closure likelihood in your local area:
Step 1: Select Your Country & Region
Use the dropdown menu to select between the United States and Canada. This ensures that the geocoding engine matches your exact municipal territory and correctly parses 5-digit US ZIP codes versus 6-character Canadian Postal Codes (e.g., M5V 2T6 in Toronto or T2P 1J9 in Calgary).
Step 2: Enter Your City, ZIP, or Postal Code
Type your municipality name (e.g., “Denver, CO” or “Buffalo, NY”) or your local postal code directly into the location search bar. Alternatively, click any of our pre-configured quick-pick location pills (Boston, Denver, Chicago, Buffalo, Minneapolis, Toronto, or Calgary) to load instant meteorological data for iconic winter storm hubs.
Step 3: Choose Your Preferred Weather Units
Toggle between Imperial units (degrees Fahrenheit, snowfall in inches, wind in miles per hour) and Metric units (degrees Celsius, snowfall in centimeters, wind in kilometers per hour). The calculator dynamically converts all displayed data points with zero page reloads.
Step 4: Execute the Predictive Analysis
Click the blue Check Snow Day Odds button. In less than 500 milliseconds, our engine interfaces with high-resolution numerical weather prediction models, extracts local atmospheric boundary layer conditions, and calculates your school closure likelihood score.
Step 5: Review the Detailed Results & Action Bar
Examine the animated score meter (0% to 100%), the risk level tier badge (Very Low, Low, Moderate, High, or Extreme), and the 6 granular meteorological boxes: Current Temperature, Snowfall Depth, Precipitation Odds, Wind Speed & Gusts, Sky Condition, and Commute Risk Level. Use the built-in action buttons to copy the full weather summary to your clipboard, print a clean report, or clear inputs to test an adjacent school district.
Parent & Family Winter Storm Preparation Guide
When the Snow Day Calculator indicates high odds (>70%) of a school closure, parents and caregivers should execute proactive preparations rather than waiting for an emergency automated phone call at 6:00 AM:
1. Verify Emergency Notification Channels
Ensure that your contact phone numbers, email addresses, and SMS preferences are updated in your school district’s student information system (e.g., PowerSchool, Infinite Campus, ParentSquare). Follow your district’s verified social media channels and download local news station broadcast apps that push push-notifications for school closing tickers.
2. Establish Contingency Childcare Protocols
Working parents—especially healthcare workers, first responders, and essential utility personnel—must have back-up childcare networks established prior to the winter season. Coordinate with neighborhood families to form emergency “snow day co-ops” where one parent supervises children while others commute to essential work shifts.
3. Prepare Warm Home Comfort Meals
Snow days are a cherished childhood tradition that provide quality family bonding time. Plan ahead with hearty, slow-cooked meals such as roast turkey or holiday ham. You can compute exact meat baking times, internal temperatures, and resting periods using our free culinary Calculadora de tempo de cozedura do presunto.
4. Winterize Family Vehicles & Clear Walkways
Inspect vehicle tire tread depth, top off washer fluid with sub-zero de-icer formula, and keep an emergency vehicle kit containing a heavy ice scraper, blankets, flashlight, and jumper cables. When clearing personal driveways, apply pet-safe calcium magnesium acetate (CMA) or sand rather than heavy sodium chloride to protect residential concrete surfaces from surface spalling.
5. Maintain Remote Learning Devices & Power Reserves
If your school district utilizes Flexible Instruction Days (FIDs) or asynchronous remote learning during snow days, ensure school-issued laptops and tablets are fully charged the evening before the storm. Keep battery backup banks ready in case falling ice-laden tree branches knock out local electrical power grids.
Related Computational Tools & Winter Planning Calculators
Explore our suite of specialized engineering, financial, agricultural, and scheduling tools designed to assist families, contractors, and business owners throughout every season:
- Calculadora de tempo de cozedura do presunto: Calculate exact roasting times, internal core temperatures, and honey-Dijon glaze schedules for holiday family dinners during snow days.
- Calculadora do dia a dia: Compute the precise calendar duration between dates, track academic school quarters, and plan snow makeup days across the semester.
- Calculadora de Horas Trabalhadas: Track employee work hours, overtime, lunch breaks, and payroll decimals for municipal plowing crews and emergency road workers.
- Calculadora de Gestação Bovina: Estimate bovine calving dates, gestation stages, and winter shelter nutrition for livestock herds and farm operations.
- Calculadora de portagens da PA Turnpike: Plan interstate toll charges, E-ZPass discounts, and commercial travel routes across Pennsylvania during adverse winter driving conditions.
- Calculadora de custos de lajes de betão: Estimate materials, ready-mix yards, and labor costs for pouring freeze-resistant patios, garage floors, and heated driveway slabs.
- Calculadora de margem de lucro: Calculate wholesale product markup percentages, profit margins, and retail pricing for winter hardware supplies, salt, and snow equipment.
- Calculadora de Salários do Texas: Calculate net take-home earnings, federal withholding taxes, and overtime wages for hourly municipal and commercial employees.